





‹
›
‹
›
Rock (Polarizing) Microscopy Software
Polarization microscopy software is an indispensable instrument for researching and identifying birefringent substances by virtue of the polarization properties of light. It allows users to carry out plane-polarized light observation, cross-polarized light observation and conoscopic observation.
Widely used in research and testing within fields including geology, chemical engineering, medicine and pharmaceuticals, it also supports crystalline phase observation of liquid polymer materials, biopolymers and liquid crystal materials. It serves as an ideal tool for research and teaching in scientific research institutions and institutions of higher learning.
Image Analysis
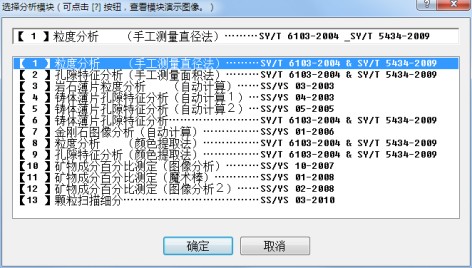
【1】 Particle Size Analysis (Manual Diameter Measurement Method) ………SY/T 6103-2004 & SY/T 5434-2009
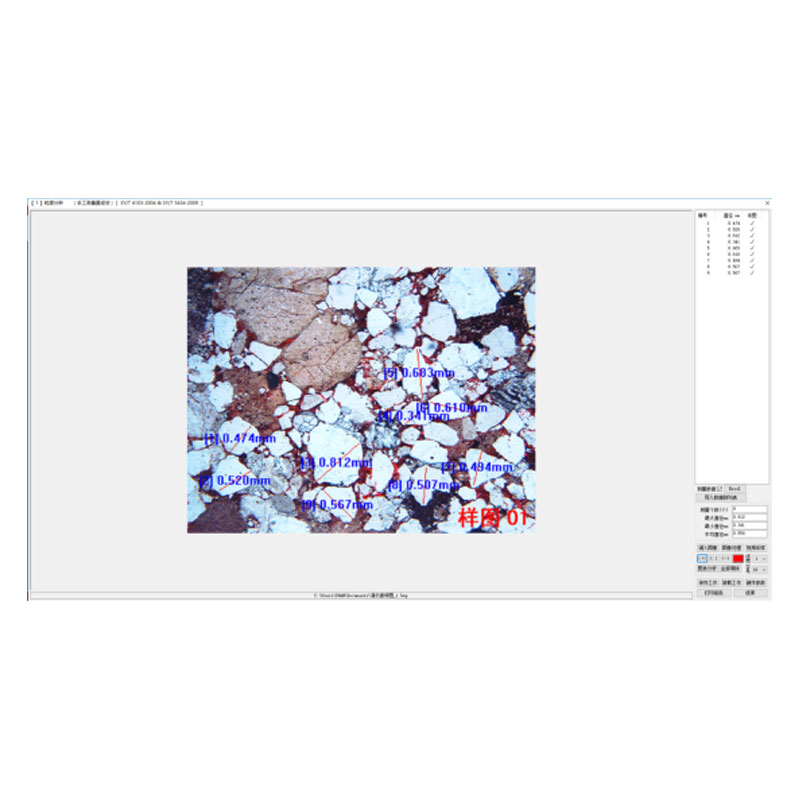
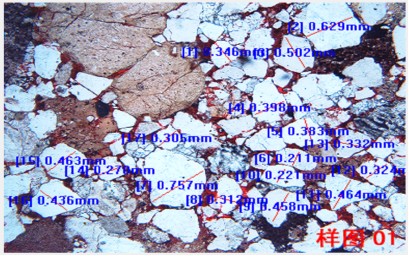
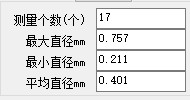
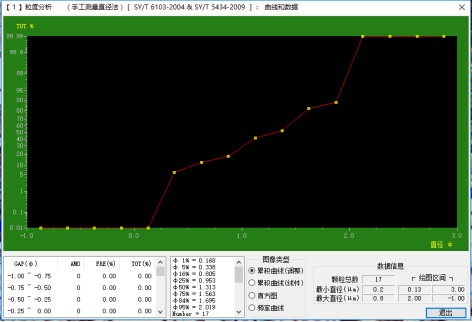
l Measure particle diameters by dragging the mouse; calculate the maximum, minimum and average diameters; automatically generate 4 types of curves including adjusted cumulative curve, linear cumulative curve, histogram and frequency curve; the measurement process can be saved and loaded.
l Analysis Interface
l Measurement Screenshot
l Analysis Data
l Data Statistical Chart
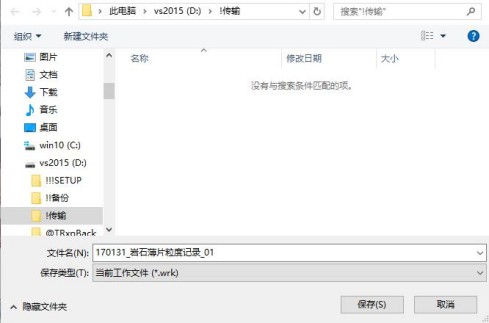
(Save the current work as a file)
【2】 Pore Characteristic Analysis (Manual Area Measurement Method) ………SY/T 6103-2004 & SY/T 5434-2009
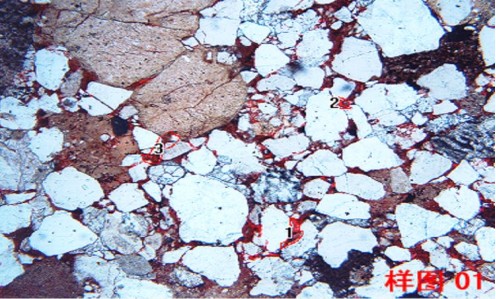
l Outline the pore area by dragging the mouse to obtain the pore area, and the software automatically calculates the porosity; the measurement process can be saved and loaded.
l Analysis Interface
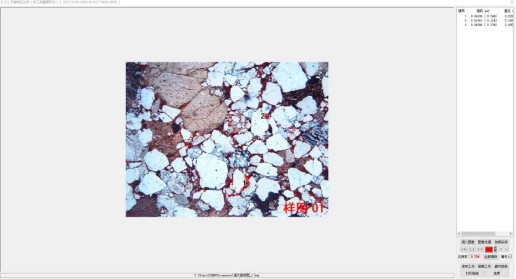
l Measurement Process Screenshot
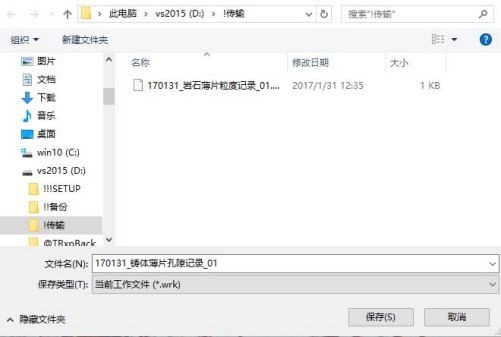
(Save the current work as a file)
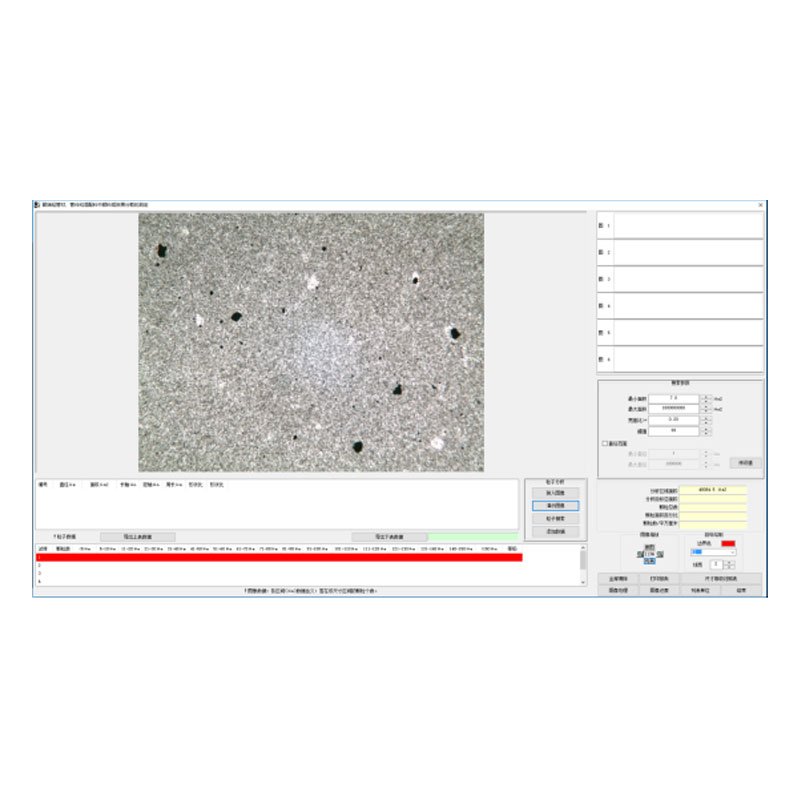
【3】 Rock Thin Section Particle Size Analysis (Automatic Calculation) ………SS/YS 03-2003
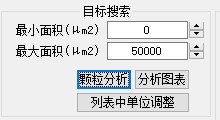
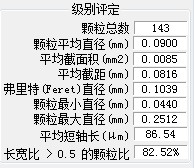
l Select the colors of particles to be analyzed on the image with the mouse (up to 6 colors available), then set the search parameters to identify the target particles and calculate the particle percentage. Meanwhile, it automatically computes a series of data including total number of particles, average particle diameter, average cross-sectional area, average intercept length, Feret diameter, minimum diameter, maximum diameter, average minor axis length, and the proportion of particles with an aspect ratio greater than 0.5.
l Analysis Interface
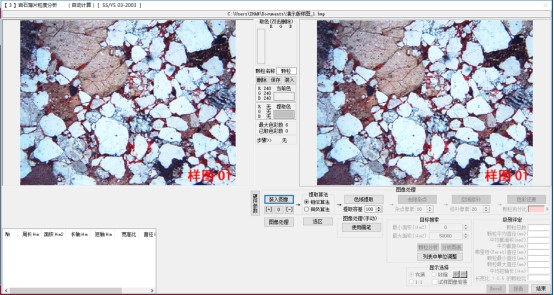
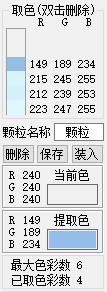
l Click on the image to pick colors
l Perform corresponding processing on the image as required
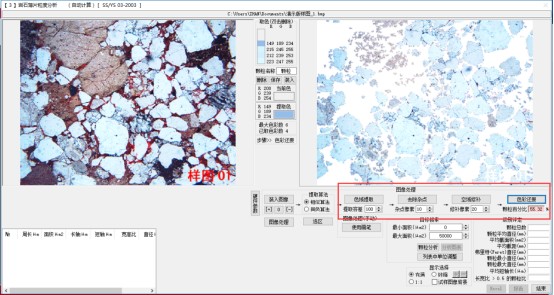
l Click "Particle Analysis" to process the image
l Analysis Data
【4】 Cast Thin Section Pore Characteristic Analysis (Automatic Calculation 1) ………SS/YS 04-2003
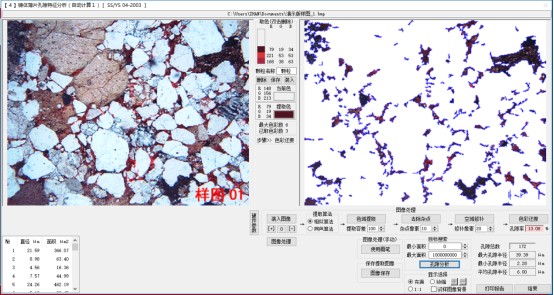
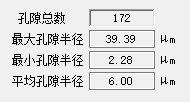
l Select the color of pores on the image with the mouse, then set the search parameters to identify the target pores. The software will automatically calculate the porosity, as well as a series of values including total number of pores, maximum pore radius, minimum pore radius and average pore radius.
l Analysis Interface
l Analysis Data
【5】Cast Thin Section Pore Characteristic Analysis (Automatic Calculation 2) ………SS/YS 05-2005
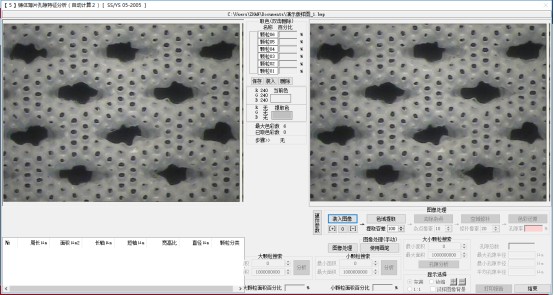
l Select the color of pores on the image with the mouse, then set the search parameters to identify the pores. The software will automatically calculate the porosity, as well as a series of values including total number of pores, maximum pore radius, minimum pore radius and average pore radius.
l Analysis Interface
【6】Cast Thin Section Pore Characteristic Analysis ………SY/T 6103-2004 & SY/T 5434-2009
l Select the color of pores on the image with the mouse, then set the search parameters to identify the pores. The software will automatically calculate the porosity, as well as a series of values including total number of pores, maximum pore radius, minimum pore radius and average pore radius.
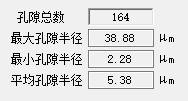
l Software Interface
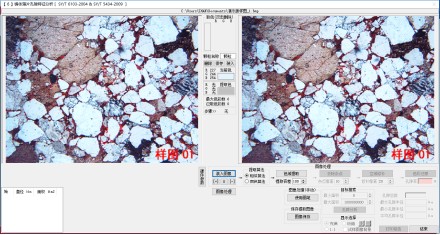
l Analyzed Data
【7】Diamond Image Analysis (Automatic Calculation) ………SS/YS 01-2006
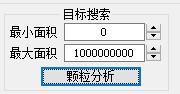
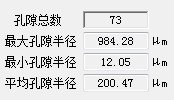
l Select the target color on the image with the mouse, then set the search parameters to identify diamond particles. The software will automatically calculate the area percentage of diamonds, as well as a series of values including total number of pores, maximum pore radius, minimum pore radius and average pore radius.
l Software Interface
l Analyzed Data
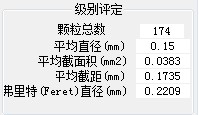
【8】Particle Size Analysis (Color Extraction Method) ………SY/T 6103-2004 & SY/T 5434-2009
l Select the colors of particles to be analyzed on the image with the mouse (up to 6 colors available), then set the search parameters to identify the target particles and calculate the particle percentage. Meanwhile, it automatically computes a series of values including total number of particles, average diameter, average cross-sectional area, average intercept length, Feret diameter and other related parameters.
l Software Interface
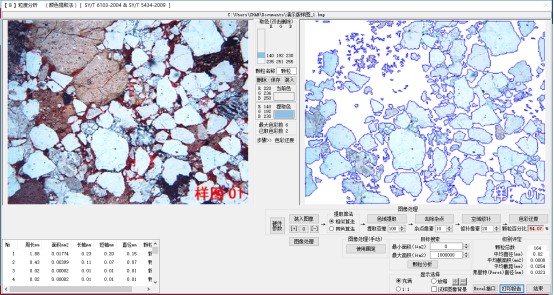
l Analyzed Data
【9】Pore Characteristic Analysis (Color Extraction Method) ………SY/T 6103-2004 & SY/T 5434-2009
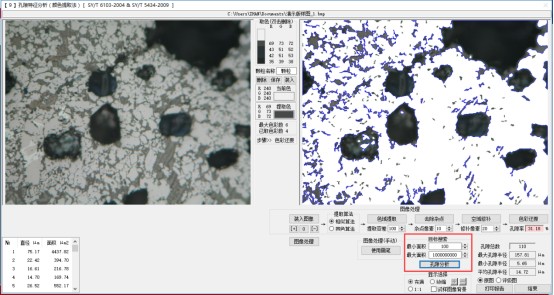
l Select the colors of pores to be analyzed on the image with the mouse (up to 6 colors available), then set the search parameters to identify the target pores and calculate the porosity. Meanwhile, it automatically computes a series of values including total number of pores, maximum pore radius, minimum pore radius, average pore radius and other related parameters.
l Analysis Interface
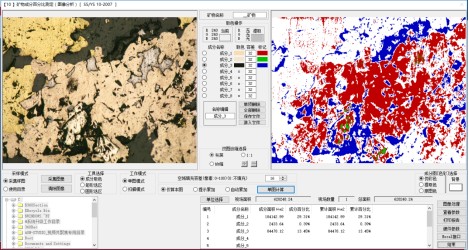
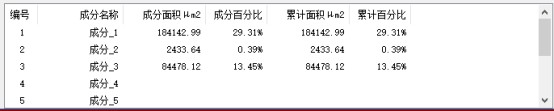
【10】Mineral Composition Percentage Determination (Image Analysis) ………SS/YS 10-2007
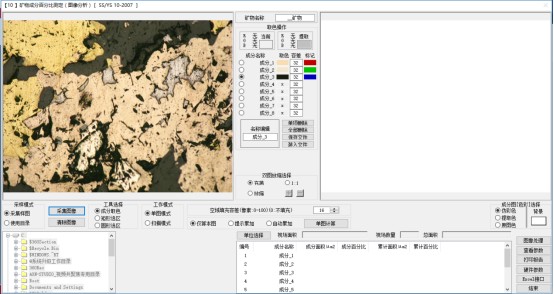
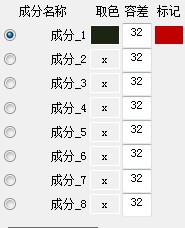
l Select the colors of 8 types of components with the mouse, and set the tolerance for each component. Based on these data, the software identifies the corresponding structures on the image and calculates their area and area percentage. It supports both single-image analysis and batch analysis of all images in a specified directory.
l Analysis Interface
l Click the corresponding component and pick its color on the image.
l Click the "Single Image Calculation" button to perform the analysis.
l Data List
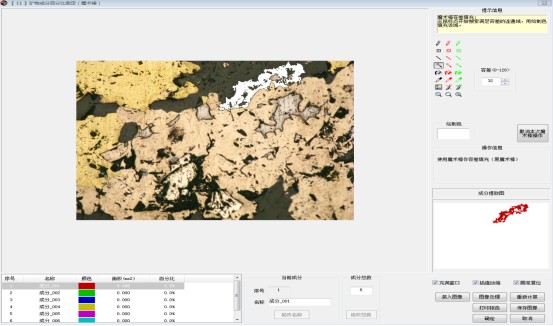
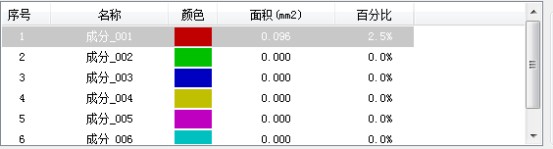
【11】Mineral Composition Percentage Determination (Magic Wand) ………SS/YS 01-2008
l Select the structures to be analyzed on the rock image with the magic wand tool, and the software will calculate their area and area percentage.
l Analysis Interface
l Analyzed Data List
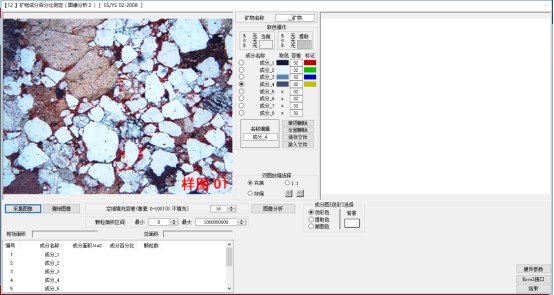
【12】Mineral Composition Percentage Determination (Image Analysis 2) ………SS/YS 02-2008
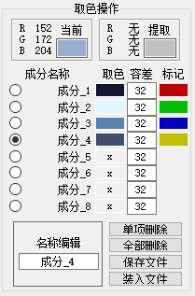
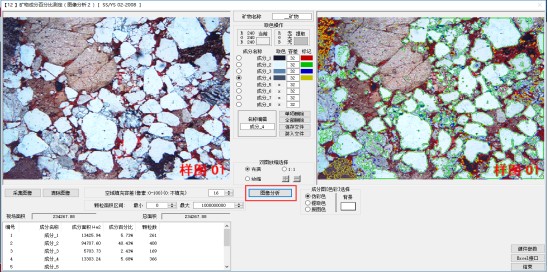
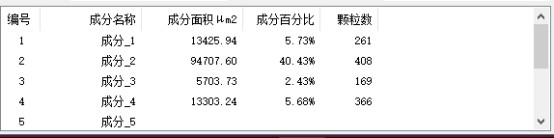
l Select the colors of 8 types of components with the mouse, and set the tolerance for each component. Based on these data, the software identifies the corresponding structures on the image and calculates their area and area percentage.
l Analysis Interface
l Click the corresponding component and pick its color on the image.
l Click the "Image Analysis" button to process the image
l Analyzed Data List
Shandong Laishi Automation Technology Co., Ltd. (hereinafter referred to as "Laishi") is composed of a technical team with more than 10 years of research and development and manufacturing experience. The registered capital of the company is 3 million yuan. We specialize in the research and development, production, and sales of various desktop hardness testers and metallographic sampling equipment, and provide professional research and sales services for physical and chemical testing instruments, laboratory equipment, analytical equipment, and automation equipment.
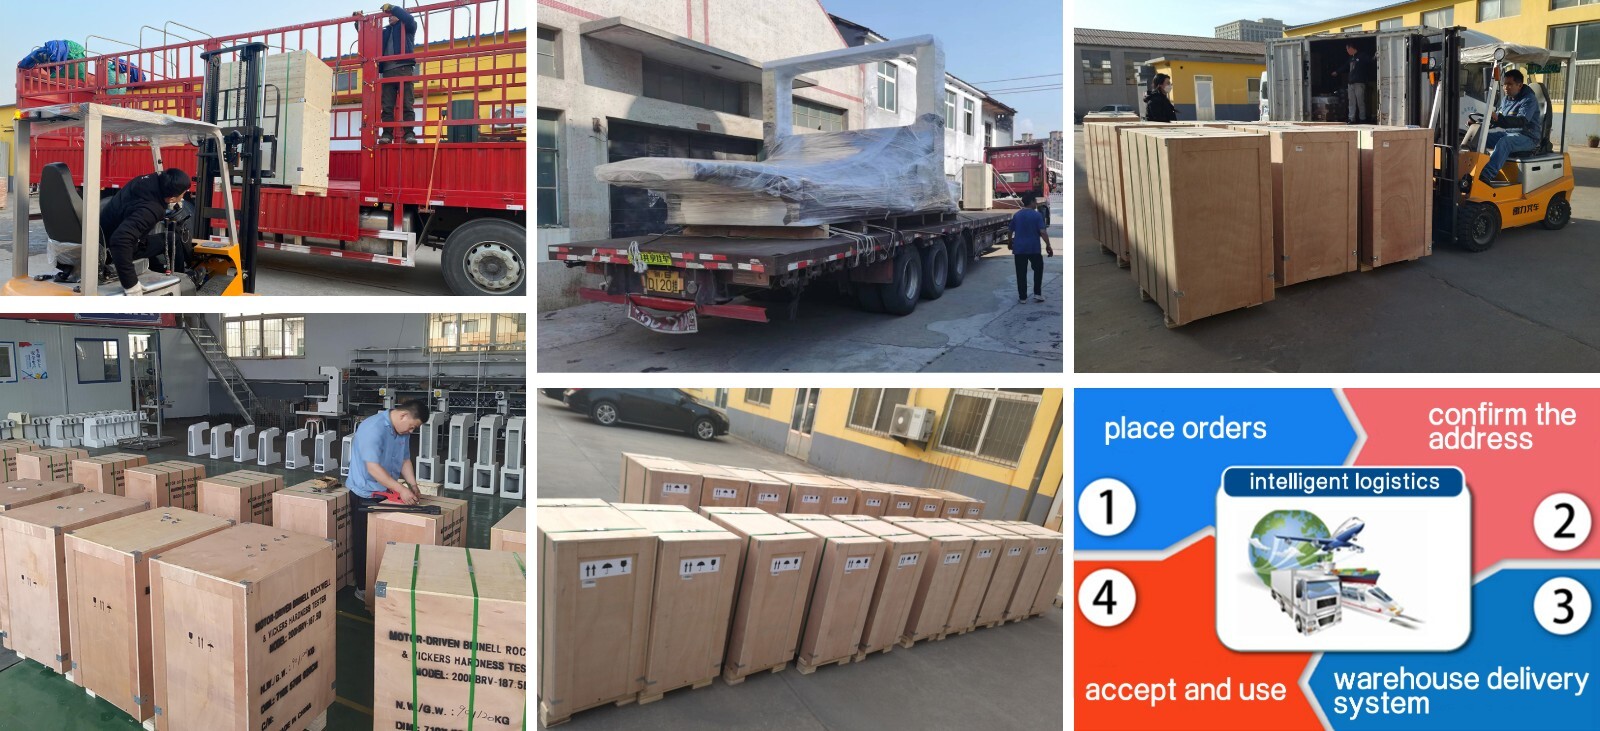
Packaging and Shipping
Have an inquiry or some feedbak for us? Fill out the form below to contact our team.
Related Product Recommendations
 Introduction to the Fiber Software SystemMore Details +
 Microscopy Software") Rock (Polarizing) Microscopy SoftwareMore Details +
Rock (Polarizing) Microscopy SoftwareMore Details + Porosity Image Analysis SystemMore Details +
 Introduction to Particle Size Image Analysis SoftwareMore Details +
 Introduction to Cleanliness Image Analysis SoftwareMore Details +
 Genuine FMIA2025 Metallographic Image Analysis SoftwareMore Details +
 FHF2024 Weld Penetration Measurement SoftwareMore Details +
 FEG Series Digital Microscope CameraMore Details +
 FCL-RS Metallographic Image Measurement SoftwareMore Details +
 Carbon Black Microscopic Dispersion Measurement Software 2024More Details +
Search Starts Here


Our Email